Tag Archives: Homes for sale in Santa Cruz

Santa Cruz Home Sales Prices Set New Highs, Again

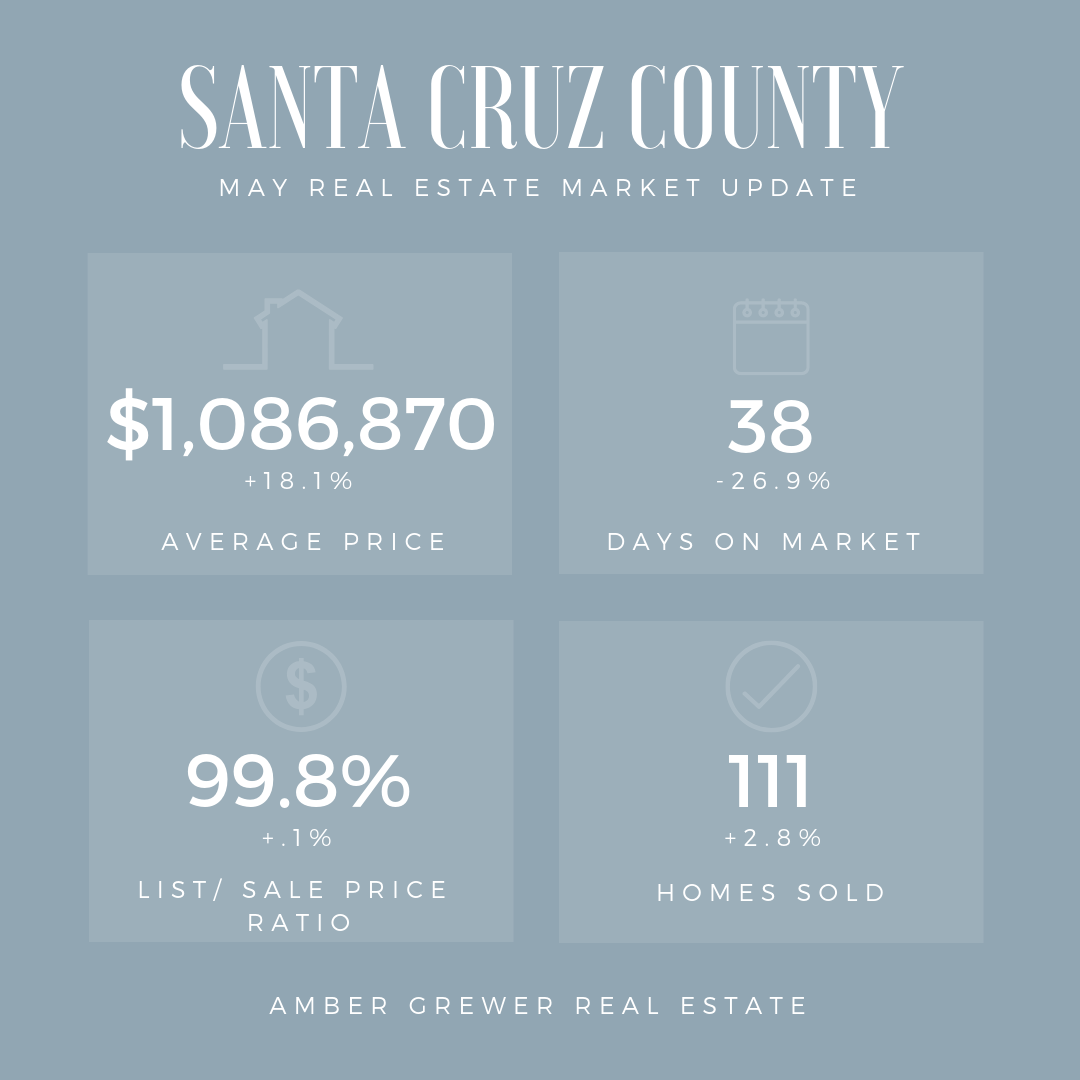
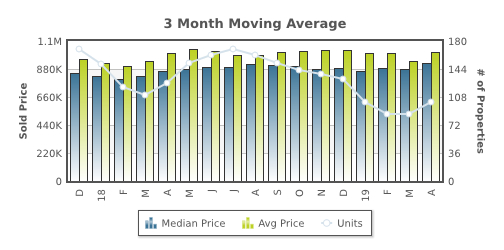
The median sales price for single-family, re-sale homes rose 52.9% year-over-year last month to set a new high for the second month in a row. That is the twelfth month in a row the median sales price has been higher than the year before.

The average sales price also set a new high for the second month in a row. It rose 44.7%, year-over-year.

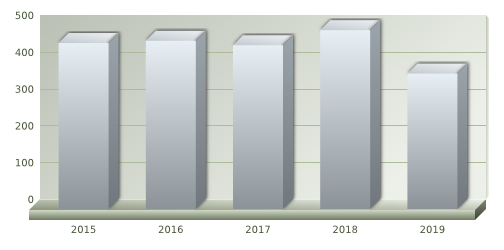
Home sales were up 114.6% year-over-year. There were 191 homes sold in Santa Cruz County last month. The average since 2000 is 157.

Inventory was down for the twentieth month in a row. Active listings dropped 34% compared to last year.

As of June 5th, there were only 175 homes for sale in Santa Cruz County. The average since January 2003 is 681.

The sales price to list price ratio stayed over 100% for the tenth month in a row. It went from 107.7% to 107.5%.

Two hundred and fifty-three homes went into escrow last month, a gain of 11% compared to last year.

Days of Inventory rose from twenty to twenty-seven. The average since 2003 is one hundred and thirty-nine.

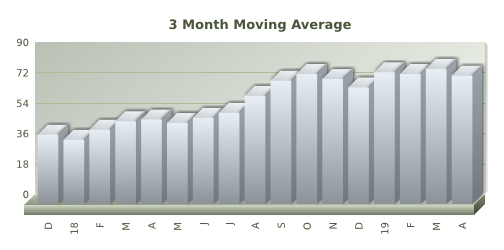
Days on market rose from eighteen to twenty-three. That is the time from when a home is listed to when it goes into contract.

The median sales price for condos set a new high. It rose 32.6% year-over-year. The average sales price also set a new high. It rose 45.5%.

Condo sales were up 68% year-over-year. Forty-two condos were sold last month.

Inventory was down 72.4%.

As of June 5th, there were twenty-four condos for sale in Santa Cruz County. The average since January 2003 is 141.

Days of inventory fell to seventeen from eighteen.

It took fifteen days, on average, to sell a condo last month.

If you are planning on selling your property, call me for a free comparative market analysis.

2,600 total views, no views today

May Santa Cruz County Real Estate Market Update

Home Sale Information for Santa Cruz County

Prices

Big news for the Santa Cruz Real Estate Market- the median sales price for Santa Cruz County single-family, re-sale homes set a new high of $950,000 in April. It was up 6.1% from last year. The average sales price rose 3.7% and went back over $1,000,000.

The sales price to list price ratio continues to hover just below 100%. It was 99.8% last month.

Sales

Home sales were down, year-over-year, for the ninth month in a row in Santa Cruz County. There were 111 homes sold in Santa Cruz County last month. The average since 2003 is 158.

3 month moving average for Santa Cruz home prices

Inventory

Inventory continues to expand in Santa Cruz County. It has been higher than the year before ten months in a row. Last month, it was up 30.4% over last year.

As of May 5th, there were 330 homes for sale in Santa Cruz County. The average since January 2003 is 681.

Days of Inventory was at eighty-six. The average since 2003 is one hundred and thirty-nine.

Days of inventory chart for Santa Cruz County

Time It Takes To Sell A Home In Santa Cruz

It took only thirty-eight days to sell a home last month in Santa Cruz County. That is the time from when a home is listed to when it goes into contract.

Santa Cruz County Home Sales
Santa Cruz Home Sales to Date

Condos In Santa Cruz

Prices for re-sale condos were up last month from the month before. The median sales price rose year-over-year by 4.7%. The average sales price rose 6.5%.

Condo sales were up 17.6% year-over-year. 

Inventory continues to expand. It has been higher than the year before ten months in a row. 

As of May 5th, there were 82 condos for sale in Santa Cruz County. The average since January 2003 is 141.

Days of inventory rose to fifty-nine.

It is taking forty-seven days to sell a condo.

If you are thinking of buying or selling a home, please contact me today!

To read my full Santa Cruz Real Estate Market Update, view in depth information by area or to receive this market update in your inbox monthly, click here.

1,287 total views, no views today